If you can’t measure it, you can’t improve it
Never trust a statistic that you didn’t pimp yourself
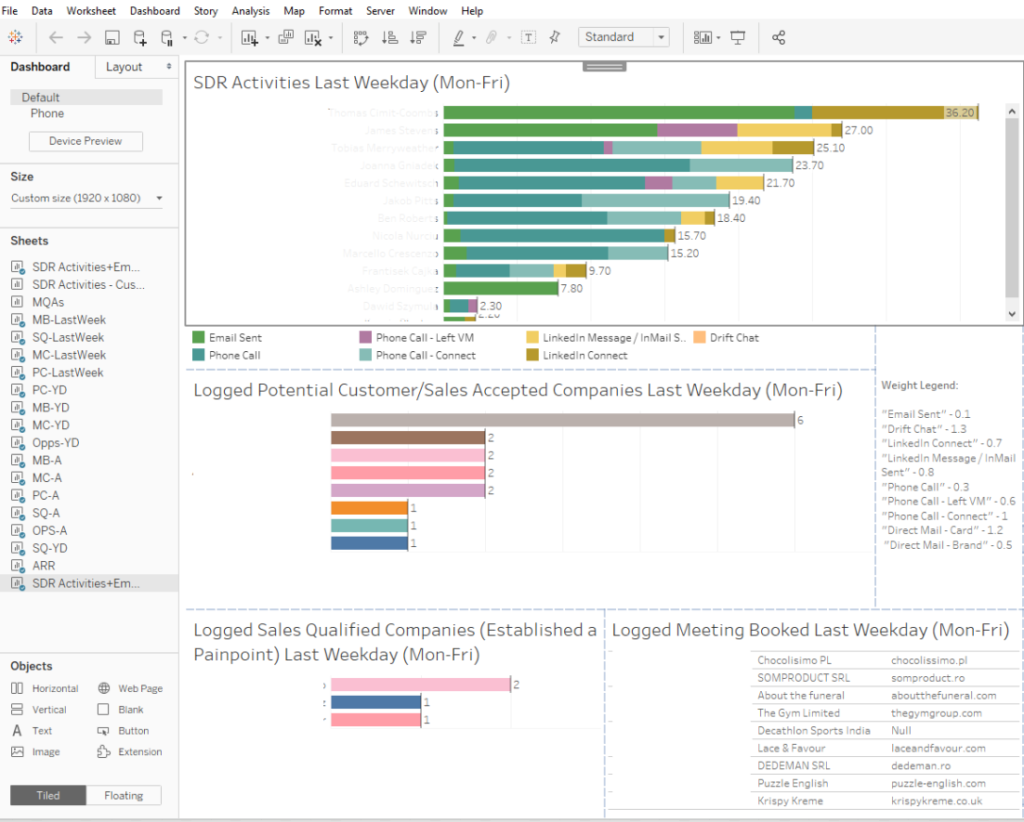
Seeing is Believing
Everyone can create rising graphs and charts, but be careful when you ask about the depths of the data and what it *actually* means. You don’t need confidence intervals, levels of significance or standard deviation all the time, but it helps.
Challenges tackled:
- KPI definition based on department & company goals
- Create reporting framework based on Martech ecosystem
- Tracking of all online & offline (marketing) activity
- Set benchmarks and implement learnings
- Fail quickly!